Archive
Centralizing Users’ Authentication at Active Directory Level
First of all, sorry for my long absence.
One month ago, I had a talk at TechInsights South East Asia, 2011 related to one of my favorite security topics for centralizing user management. I thought why not share it with you guys.
I hope you enjoy it.
Peace and love …
IIS Smooth Streaming
After surviving from toughest weeks of final exams, having a talk at MIND (Malaysian Independent Developers) event was an amazing relief. My chosen topic was IIS Smooth Streaming from development prospective. After a good presentation, I decided to share the resulting presentation file in my blog to make it available to wider audience.
This work is a collection of notes around the web that can be gathered together to form a solid scenario. I hope you enjoy it.
Finally I should deeply thank some respected members of the community because of their helps and their informative presentations at this event: Daqing Lee, Riza Marhaban, Arsalan Pour Fard and Mostafa Abedi.
MS Chart Part 3 (Combining Different Chart-Types)
Sometimes you may need to combine two or more different Chart-Types. In this article we go through the stages of creating a composite MS Chart. In this project we make a Pareto function to show how to combine two different chart types in a single ChartArea.
Pareto chart: A Pareto chart, named after Vilfredo Pareto, is a type of chart that contains both bars and a line graph, where individual values are represented in descending order by bars, and the cumulative total is represented by the line (In probability distribution there are two ways to display distribution in chart, PMF (Probability Mass Function) and CDF (Cumulative Distribution Function) that can be used to display both in a single area).
The purpose of the Pareto chart is to highlight the most important among a (typically large) set of factors. In quality control, it often represents the most common sources of defects, the highest occurring type of defect, or the most frequent reasons for customer complaints, and so on. Wilkinson (2006) devised an algorithm for producing statistically-based acceptance limits (similar to confidence intervals) for each bar in the Pareto chart. The Pareto chart is one of the seven basic tools of quality control.
After a short introduction to Pareto Chart, lets start the development by starting a new project from scratch. (The reference is Microsoft MSChart sample project)
ASPX File:
<asp:Chart ID="Chart1" runat="server" Width="412px" Height="296px" BorderlineDashStyle="Solid" Palette="BrightPastel" BackSecondaryColor="White" BackGradientStyle="TopBottom" BorderWidth="2" BackColor="WhiteSmoke" BorderColor="26, 59, 105">

<Legends>

<asp:Legend Enabled="False" IsTextAutoFit="False" Name="Default" BackColor="Transparent" Font="Trebuchet MS, 8.25pt, style=Bold">

</asp:Legend>

</Legends>

<BorderSkin SkinStyle="Emboss"></BorderSkin>

<Series>

<asp:Series Name="Default" BorderColor="180, 26, 59, 105">

</asp:Series>

</Series>

<ChartAreas>

<asp:ChartArea Name="ChartArea1" BorderColor="64, 64, 64, 64" BackSecondaryColor="White" BackColor="Gainsboro" ShadowColor="Transparent" BackGradientStyle="TopBottom">

<AxisY2 IsLabelAutoFit="False" Interval="25">

<LabelStyle Font="Trebuchet MS, 8.25pt, style=Bold" />

</AxisY2>

<AxisY LineColor="64, 64, 64, 64">

<LabelStyle Font="Trebuchet MS, 8.25pt, style=Bold" />

<MajorGrid LineColor="64, 64, 64, 64" />

</AxisY>

<AxisX LineColor="64, 64, 64, 64">

<LabelStyle Font="Trebuchet MS, 8.25pt, style=Bold" />

<MajorGrid LineColor="64, 64, 64, 64" />

</AxisX>

</asp:ChartArea>

</ChartAreas>

</asp:Chart>
In the first section there is only one chart type added to the ChartArea which is a Column Chart namely Default. We add the second chart in the code behind later. I also set some of the appearance properties in asp tag to make it look better.
Code Behind:
protected void Page_Load(object sender, EventArgs e)

{

AfterLoad();

}

private void RandomData(Series series, int numOfPoints)

{

Random rand;

// Use a number to calculate a starting value for

// the pseudo-random number sequence

rand = new Random(5);

// Generate random Y values

for (int point = 0; point < numOfPoints; point++)

{

series.Points.AddY(rand.Next(49) + 1);

}

}

public void AfterLoad()

{

// Number of data points

int numOfPoints = 5;

// Generate rundom data

RandomData(Chart1.Series["Default"], numOfPoints);

// Make Pareto Chart

MakeParetoChart(Chart1, "Default", "Pareto");

// Set chart types for output data

Chart1.Series["Pareto"].ChartType = SeriesChartType.Line;

// set the markers for each point of the Pareto Line

Chart1.Series["Pareto"].IsValueShownAsLabel = true;

Chart1.Series["Pareto"].MarkerColor = Color.Red;

Chart1.Series["Pareto"].MarkerBorderColor = Color.MidnightBlue;

Chart1.Series["Pareto"].MarkerStyle = MarkerStyle.Circle;

Chart1.Series["Pareto"].MarkerSize = 8;

Chart1.Series["Pareto"].LabelFormat = "0.#";  // format with one decimal and leading zero

// Set Color of line Pareto chart

Chart1.Series["Pareto"].Color = Color.FromArgb(252, 180, 65);

}

void MakeParetoChart(Chart chart, string srcSeriesName, string destSeriesName)

{

// get name of the ChartAre of the source series

string strChartArea = chart.Series[srcSeriesName].ChartArea;

// ensure that the source series is a column chart type

chart.Series[srcSeriesName].ChartType = SeriesChartType.Column;

// sort the data in all series by their values in descending order

chart.DataManipulator.Sort(PointSortOrder.Descending, srcSeriesName);

// find the total of all points in the source series

double total = 0.0;

foreach (DataPoint pt in chart.Series[srcSeriesName].Points)

total += pt.YValues[0];

// set the max value on the primary axis to total

chart.ChartAreas[strChartArea].AxisY.Maximum = total;

// create the destination series and add it to the chart

Series destSeries = new Series(destSeriesName);

chart.Series.Add(destSeries);

// ensure that the destination series is either a Line or Spline chart type

destSeries.ChartType = SeriesChartType.Line;

destSeries.BorderWidth = 3;

// assign the series to the same chart area as the column chart is assigned

destSeries.ChartArea = chart.Series[srcSeriesName].ChartArea;

// assign this series to use the secondary axis and set it maximum to be 100%

destSeries.YAxisType = AxisType.Secondary;

chart.ChartAreas[strChartArea].AxisY2.Maximum = 100;

// locale specific percentage format with no decimals

chart.ChartAreas[strChartArea].AxisY2.LabelStyle.Format = "P0";

// turn off the end point values of the primary X axis

chart.ChartAreas[strChartArea].AxisX.LabelStyle.IsEndLabelVisible = false;

double percentage = 0.0;

foreach (DataPoint pt in chart.Series[srcSeriesName].Points)

{

percentage += (pt.YValues[0] / total * 100.0);

destSeries.Points.Add(Math.Round(percentage, 2));

}

}
There isn’t any specific chart type for Pareto; we should make it as a combination of two different chart types called Column and Line which is done in the code behind as described below.
Random():
This function is responsible to make 5 random values between 0 to maximum 49 which is called repeatedly in different sections of the project.
AfterLoad():
This method is called in Page_Load event handler which is responsible to handle the whole process. Firstly, it sets 5 random values to Default series which is a column chart type. Next, it calls MakeParetoChart() (which is described later)to create a second line chart, then, it sets some appearance properties to the new generated series.
MakeParetoChart():
This method is responsible to add the second series called Pareto to the chart area. This series is a line chart for the pareto.
And yes it is over. Hope you found it interesting.
I am looking forward to reading your comments bout this post.
MS Chart Part 2 (A brief description of different Chart-Types)
This post describes mostly about the use cases of a collection of popular chart-types. Besides, I go a bit further demonstrating how to developing it in .Net MsChart through short code snippets. If you are new to this area you can find it easier to start it with my previous post here.

Different Chart-Types:
In the previous post, I taught the basics of MsChart with two easiest chart-types; MS Chart and Bar-Chart . In this post you can read deeper about other more complex charts with short development details.
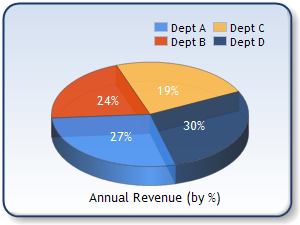
– Pie and Doughnut Chart: Pie charts are common in business and journalism, perhaps because they are perceived as being less
“geeky” than other types of graph. However statisticians generally regard pie charts as a poor method of displaying information, and they are uncommon in scientific literature. It is mostly used in reports as just look and get the point (for top level managers and ordinary users) maybe because It is easy to distinguish but not accurate.
As easily as changing the following code of the previous article you can change your Bar-Chart to Pie-Chart:
original: MSChart.Series[“Series1”].ChartType = SeriesChartType.Column;
updated: MSChart.Series[“Series1”].ChartType = SeriesChartType.Pie;
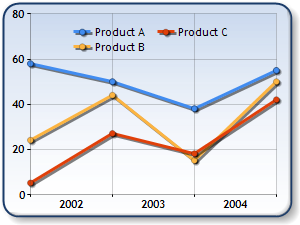
– Line Chart: A line chart is often used to visualize a trend in data over intervals of time (or other units) – a time series – thus the line is often drawn chronologically. It is mostly used by statisticians because of the accuracy and visualization.
As easily as changing the following code of the previous article you can change your Bar-Chart to Line-Chart:
original: MSChart.Series[“Series1”].ChartType = SeriesChartType.Column;
updated: MSChart.Series[“Series1”].ChartType = SeriesChartType.Line;
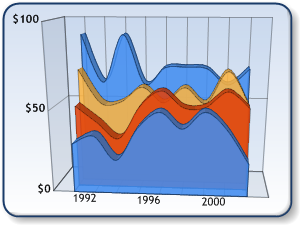
– Area-Chart: An area chart or area graph displays graphically quantitive data. It is based on the line chart. The area between axis and line are commonly emphasized with colors, textures and hatchings. Commonly one compares with an area chart with two or more quantities. It is a bit more distracting compared with Line-Chart however it is beautiful.
As easily as changing the following code of the previous article you can change your Bar-Chart to Area-Chart:
original: MSChart.Series[“Series1”].ChartType = SeriesChartType.Column;
updated:MSChart.Series[“Series1”].ChartType = SeriesChartType.SplineArea;
– Radar-Chart: A radar chart is a graphical method of displaying multivariate data in the form of a two-dimensional chart of three or more quantitative variables represented on axes starting from the same point. The relative position and angle of the axes is typically uninformative. The radar chart is also known as web chart, spider chart, star chart, cobweb chart, star plot, irregular polygon, polar chart, or kiviat diagram.
One application of radar charts is the control of quality improvement to display the performance metrics of any ongoing program. They are also being used in sports to chart players’ strengths and weaknesses, where they are usually called spider charts.
As easily as changing the following code of the previous article you can change your Bar-Chart to Radar-Chart:
original: MSChart.Series[“Series1”].ChartType = SeriesChartType.Column;
updated: MSChart.Series[“Series1”].ChartType = SeriesChartType.Radar;
– Funnel-Chart: Funnel charts are a type of chart, often used to represent stages in a sales process and show the amount of potential revenue for each stage. This type of chart can also be useful in identifying potential problem areas in an organization’s sales processes. A funnel chart is similar to a stacked percent bar chart. A funnel chart displays values as progressively decreasing proportions. The size of the area is determined by the series value as a percentage of the total of all values.
As easily as changing the following code of the previous article you can change your Bar-Chart to Funnel-Chart:
original: MSChart.Series[“Series1”].ChartType = SeriesChartType.Column;
updated: MSChart.Series[“Series1”].ChartType = SeriesChartType.Funnel;
To make your chart the most beautiful one in the planet, add these codes to make it look hotter. 🙂
 // Set funnel Y values style
MSChart.Series["Series1"]["FunnelStyle"] = "YIsHeight";
// Set funnel data point labels style
MSChart.Series["Series1"]["FunnelLabelStyle"] = "Outside";
// Place labels on the left side
MSChart.Series["Series1"]["FunnelOutsideLabelPlacement"] = "Left";
// Set gap between points
MSChart.Series["Series1"]["FunnelPointGap"] = "2";
// Set minimum point height
MSChart.Series["Series1"]["FunnelMinPointHeight"] = "1";
// Set 3D angle
MSChart.Series["Series1"]["Funnel3DRotationAngle"] = "7";
// Set 3D drawing style
MSChart.Series["Series1"]["Funnel3DDrawingStyle"] = "CircularBase";
This is the end. I am looking forward to reading your comments and feedbacks.
*Reference: www.wikipedia.com.
Web forms or ASHX (Handlers) (a short differentiation)
“What should I choose [Web-forms or Handlers] when I want a simple response from the server? “. After 6 years of development with C#.net I heard this question a lot. Due to this, I decide to answer it here.
Assume that you are developing a JQuery AJAX based application that sends its requests to servers and receives a specific response from it. In this case the first solution that may strike you is using handlers. Maybe because of some features I list here:
– It returns only a specific response; it is so light and is not derived from a heavy class that may have some performance penalties.
– Unlike a web form it doesn’t need to compile its interface, generates HTML and returns the generated HTML to clients.
– Unlike web services (mostly used before .Net 3.0), it returns almost all of request’s properties. One of the most prominent one is users’ identity.
Yes, using Handlers has many, many benefits but choosing to use them for such purpose may bring many problems as well.
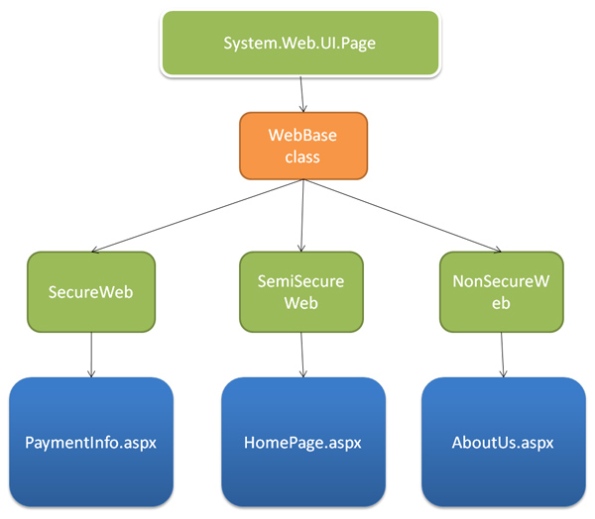
In a standard web-form programming (I’d better say as a good OOP practice) you should implement a multi-layered
inheritance for all of your web-forms. It is totally a beginner’s mistake to inherit a web-form directly from System.Web.UI.Page.
In this approach (Fig 2.0) you distribute each group of actions to separate layers. For instance, you place secure parts (handling authorized users) inside SecurityWeb class, non-secure parts placed into NonSecureWeb class etc. Finally, all of your customized classes can inherit from WebBase class which executes your common and shared operations. WebBase class is also derived from the built-in System.Web.UI.Page class.
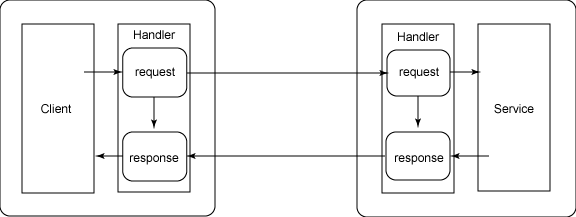
Now, you have built a clean architecture for security, caching, common operations/properties and many more. Just assume that you want to enforce all of the functionalities you defined in your layered architecture take place in you AJAX handlers. Assuming that you handle the incoming requests with a handler class. A handler class that cannot inherit anything from a parent class. So there is almost no clean and neat way to have all of your efforts happen before executing the handler’s block. You have no choice to make external calls to other classes by passing heavy objects and parsing the return values!!
This is just duplicating many of your codes that results in inconsistent and non-secure consequences.
Better solution:
The alternative is to replace the handler class with a web-form one that inherits from an/other parent class/es. Now you can have all of the important actions happen in almost everywhere without any code duplication or security problem outcomes.
Indeed, Web forms are heavy, very heavy. Here I provided my common practice to decrease some weigh of this fatty class.
How to make web forms act close to handlers:
By adding the following code you can easily change the behavior of ASPX files to act similarly with ASHX files:
Response.Clear();
Response.ContentType = "text/html";
Response.Expires = -1;
Response.CacheControl = "no-cache";
Response.AddHeader("Pragma", "no-cache");
Line6: string response = "";</pre>
<pre>// your process over Request and generate the Response</pre>
<pre>Response.Write(response);
Response.End();
Above, is a sample that returns a text. Obviously, you can change it to any desired return value. Line 6 is where you should place your operation to feed the response variable.
You reached the end:). I should thank for your attention, deeply appreciate your sharing thoughts about this post and looking forward to receiving them here 😉
Umbraco – A new taste of development
An open source CMS but this time in C#. I saw many applications on the web (refer to http://csharp-source.net, http://csharpopensource.com/ or this one http://www.dotnetopen.net/) that offer many open source apps in .Net but can anyone of them run huge applications such as www.asp.net or wired.co.uk?
Umbraco is an open source CMS in C# which could run www.asp.net and wired.co.uk and far too many other enterprise web apps (claiming more than 85000 installations). Yes it is based on open source license and it is chosen by many organizations such as Toyota and Microsoft.
Niels Hartvig, is the founder of this CMS. He was a simple Danish man who started changing his world by developing his idea. And again a developer made it.
This CMS can be easily used freely to start a personal web site, a business web site, a forum or … and also can be used by developers to build their own customized CMS based on their needs.
It is 100% based on .Net and was coded in MVC. It can be opened easily in VStudio or WebMatrix (there is a template for Umbraco in WebMatrix) to make any alteration. Furthermore, it can be connected to MSSql Server or MySql Server. You can also code for your own DBMS. Moreover, you can plan it over Windows Azure. For all you need to know about development, they have an active forum talking about development issues or just see this video to be shocked about the power of this CMS.
There is a really nice section in their web site called [Make A Wish], in which you can post any idea that you think is missed.
The last thing you should know is Umbraco’s base application is 100% free of charge unless you prefer it can be bundled with guaranteed and professional support, bug fixing warranty and productivity enhancing add-ons.
Why waiting so long, download it and start your own web ;))
.Net Generics (Performance and flexibility)
I discussed the reason of using Generics in another article. Here it’s aimed to talk about Generics in detail.
Generics are a part of CLR type system that allows you to develop your own types which are flexible in their parameters’ type. Therefore, it allows you to help your consumers feel comfortable while using your class. The most common use for Generics is data types such as lists, linked lists, stacks, trees etc where the operations on each item is done in the same way regardless of their types.
Why using Generics:
1- Improve performance: As it’s discussed in my previous article, assume that you have a class that its parameters’ type is not specified. You have two choices to build it. One way is to use Object as your parameters’ type which in most cases it needs boxing and unboxing. The second way is to use Generics which has no boxing and unboxing but has almost the same flexibility as Object hast.
2- Less runtime errors: While you are using Object you need to convert it in order to use it. And because it is not possible to check the parameters’ type in compile-time compiler needs to do type-checking in runtime. In this case, if you cast it to wrong type compiler raises type mismatch error. In contrary, using Generics doesn’t have this issue since its strongly-typed data type, compiler can catch this matching at compile-time.
Creating generics types:
It is quite a fun. You just need to specify the name of parameters that are type flexible. After that everything is done by .Net.
class GenericsTemplate<T, U>

{

T t;

U u;

public GenericsTemplate(T t, U u)

{

this.u = u;

this.t = t;

}

public string getT

{

get { return t.ToString(); }

}

public string getU

{

get { return u.ToString(); }

}

}
Here you have a flexible class which can accept all possible types! Isn’t it easy!! :D. It can be int, string, a custom class or any other type.
How to use it:
Parameters’ type are defined in class instantiation.
class Program

{

static void Main(string[] args)

{

GenericsTemplate<string, int> genClass = new GenericsTemplate<string, int>("Hello World", 560);

Console.Write(genClass.getT + Environment.NewLine + genClass.getU);

Console.ReadKey();

}

}
Since parameters’ type is specified in declaration, compiler can check for any mismatch error.
How to use constraints:
Did you find it useful? But I think you found some limitations in using these variables inside the generic class. You can only have capabilities of base Object data-type which are ToString() and GetHashCode() methods. To overcome this problem .Net introduces a key word called where. This key word can be used to limit the range of possible types that parameter’s can accept. This limitation may also reduce the complexity of consuming your generic class since developers (consumers) won’t be confused among too many possible types can be used.
This limitation can be applied for:
1- Reference or value type: Forces a parameter to accept data-types which are either reference type or value type. (Key words are class for reference type and struct for value type)
2- Interface: Parameter can accept types which have a specific implemented interface.
3- Base class: Parameter can accept types which have a specific inherited interface.
4- Constructor: Forces a parameter to accept data-types which has a default constructor (parameterless constructor). (Key word is new())
class Program

{

static void Main(string[] args)

{

System.Drawing.Bitmap bt = new System.Drawing.Bitmap(800, 500);

//Bitmap is an inherited class from Image and int is a value type which has implemented IComparable interface

GenericsTemplate<System.Drawing.Bitmap, int> genClass = new GenericsTemplate<System.Drawing.Bitmap, int>(bt, 560);

Console.Write(genClass.getT + Environment.NewLine + genClass.getU);

Console.ReadKey();

}

}

//T should be a reference type and an instance of Image class or any class inherited from Image. U sould be value type and has implemented IComparable interface

class GenericsTemplate<T, U> where T: class, System.Drawing.Image where U: struct, IComparable

{

T t;

U u;

public GenericsTemplate(T t, U u)

{

this.u = u;

this.t = t;

}

public string getT

{

//You can use all properties of Image base class while useing t

get { return t.Width.ToString(); }

}

public string getU

{

get { return u.ToString(); }

}

}
You should follow a correct order (order as listed above).
After defining constraints for generic class you can use added capabilities of parameters inside the class. Here I used Width property of base Image class.
Boxing and Unboxing (A key reason to use Generic)
This article is a discussion about boxing and unboxing in .Net and also the ways to overcome it.
This term is mostly used when we want to convert value types to reference types or vice versa. We really should care about it in development of critical systems, web applications with high traffic or using classes or methods with frequent use.
Boxing: This is the process of converting the value of a value type variable to a reference type variable.
Assume that you want to store a user-defined type (struct) into an ArrayList (As you know user-defined/struct types are value type). Now let’s know what is stored in this ArrayList?
If you take a look at the Add() method of ArrayList, it has only one overload for this method which is Add(Object object) [and Object is a reference type]. It is good news due to the possibility of storing totally different types into each index of an ArrayList. However, it has some bad news too because it needs to convert your value type variable to a reference type variable. It means that it needs a boxing to fulfill this need.
struct TypeA

{

public int VarA;

public int VarB;

public TypeA(int VarA, int VarB)

{

this.VarA = VarA;

this.VarB = VarB;

}

}

public void TestBoxingAndUnBoxing()

{

TypeA typeA = new TypeA(10, 20);

System.Collections.ArrayList arrList = new System.Collections.ArrayList();

//Boxing occures here

arrList.Add(typeA);

}
What Happens when a boxing occurs:
1- Because value-typed variables are stored in stack, a new memory cell in heap must be allocated to store this object. Reference types use heap (dynamic memory space) to be stored.
2- The value type’s bits are copied from stack to their new location in heap.
3- The new address is returned to be stored in ArrayList. So we now have a reference type instead of a value type.
Therefore, boxing can be very expensive and sometimes harmful.
Unboxing: is, of course, exactly opposite to boxing, it is the time when a reference type is converted to a value type.
After storing value types into ArrayList, they are wanted to be used somewhere. In other words, you should convert them to their original type in order to use them.
typeA = (TypeA)arrList[0];

System.Console.Write(typeA.VarB.ToString());
What happens in unboxing?
1- It Checks whether it is null or not, then it checks whether the specified type is convertible or not. If both of the above conditions fail it returns an exception.
2- The reference of the object inside the ArrayList is returned. Then bits are copied into the value typed variable.
It has some penalties again. To overcome this problem .Net suggests using Generics when time is totally eminent (But it is a better to consider it always).
Generics is out of scope of this article; however, I describe it briefly in a sample code to show its power and its immense difference compared with objects.
Generics classes/methods are similar to type-less ones but they are not. You can specify their types before compile time when you are coding. For example for classes their types must be specified during their instantiation. Therefore, it gives you the flexibility to have different types in each instance of a class.
Code below is a comparison between a Generic class and an Object one.
//T and U are generic types. It means that you can specify their types in class instantiation. So
class GenericClass
{
public T t;
public U u;

 public GenericClass(T t, U u)
{
this.t = t;
this.u = u;
}
}

//An object class that may cause boxing and unboxing during run-time
class ObjectClass
{
public object t;
public object u;


 public ObjectClass(object t, object u)
{
this.t = t;
this.u = u;
}
}
Now I want to show you the time it takes to work with each one of them for ten million iterations.
protected void Page_Load(object sender, EventArgs e)
{
DateTime dt1 = DateTime.Now;
ObjectClass ObjClass;
for (int i = 0; i < 10000000; i++)
{
ObjClass = new ObjectClass(10, "Peace");
}
DateTime dt2 = DateTime.Now;

TimeSpan tsDef = dt2.Subtract(dt1);
Response.Write("Object: " + tsDef.TotalMilliseconds.ToString() + "
");

 dt1 = DateTime.Now;
GenericClass GenClass;
for (int i = 0; i < 10000000; i++)
{
GenClass = new GenericClass(10, "Peace");
}
dt2 = DateTime.Now;
tsDef = dt2.Subtract(dt1);
Response.Write("Generic: " + tsDef.TotalMilliseconds.ToString());
}
The result clearly shows this difference. (Of course, you get different results each time you run the program but the ratio remains almost the same)
As you see, it is near to two times faster by using the Generic types.
Reference: Jeffrey Richter, MSPress: MCTS Self-Paced Training Kit (Exam 70-536)
JQuery Autocomplete with ASP.Net
In this article I want to describe combination of Autocomplete of JQuery and ASP.Net web service. Up to now I really couldn’t find a good article about this issue so it can be useful in the web.
Autocomplete is a plugin of JQuery that you can be used to implement autocomplete with the least efforts. You can find it here.
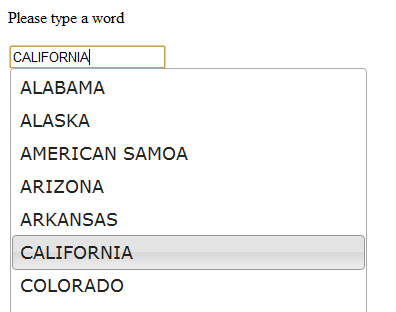
JQuery Autocomplete plugin has a property called source, in Ajax based programming you should change its source regarding what is entered into the textbox. Assume that you enter “ala” after that a callback is generated that sends some parameters to the web service (textbox.text and other parameters that you want) then in the response data you can feed source property of Autocomplete plugin. I think this stage can be your unique part of your job.
In this article I’ll discuss about generating a new callback on typing each new word and how to assign the returned value with the source property of Autocomplete plugin. You then can change the web service section with your desired code such as connecting to database and retrieving data on what is sent as parameter to the web service.
Web Service:
I start with web service because it is really simple.
using System;

using System.Collections.Generic;

using System.Linq;

using System.Web;

using System.Web.Services;

using System.Xml;

using System.Text;

using System.Web.Script.Services;

namespace ArticleDean.web.Service

{

/// <summary>

/// Summary description for WSDataService

/// </summary>

[WebService(Namespace = "http://tempuri.org/")]

[WebServiceBinding(ConformsTo = WsiProfiles.BasicProfile1_1)]

[System.ComponentModel.ToolboxItem(false)]

// To allow this Web Service to be called from script, using ASP.NET AJAX, uncomment the following line.

[ScriptService]

public class WSDataService : System.Web.Services.WebService

{

[WebMethod]

public string GetStates(string typedValue, string test)

{

test = "ALABAMA:ALASKA:AMERICAN SAMOA:ARIZONA:ARKANSAS:CALIFORNIA:COLORADO:CONNECTICUT:DELAWARE:DISTRICT OF COLUMBIA:FEDERATED STATES OF MICRONESIA:FLORIDA:GEORGIA:GUAM:HAWAII:IDAHO:ILLINOIS:INDIANA:IOWA:KANSAS:KENTUCKY:LOUISIANA:MAINE:MARSHALL ISLANDS:MARYLAND:MASSACHUSETTS:MICHIGAN:MINNESOTA:MISSISSIPPI:MISSOURI:MONTANA:NEBRASKA:NEVADA:NEW HAMPSHIRE:NEW JERSEY:NEW MEXICO:NEW YORK:NORTH CAROLINA:NORTH DAKOTA:NORTHERN MARIANA ISLANDS:OHIO:OKLAHOMA:OREGON:PALAU:PENNSYLVANIA:PUERTO RICO:RHODE ISLAND:SOUTH CAROLINA:SOUTH DAKOTA:TENNESSEE:TEXAS:UTAH:VERMONT:VIRGIN ISLANDS:VIRGINIA:WASHINGTON:WEST VIRGINIA:WISCONSIN:WYOMING";

return test;

}

}

}
The first parameter that web service gets is typedValue. This parameter returns the typed value in textbox. The second parameter is a test one; it is just to show how to send more than one parameter in JSON datatype. You can use them to retrieve your desired data from database but here we just return a long text with ‘:’ separator (This is for training purpose).
ASPX file:

Sorry that it is Image, because of the problem of wordpress to accept html and aspx code, I have to publish this section in image
In the front of the source, there is a function that returns the callback result. It has two parameters, the second one is a method called response (this is a key note) that you should pass the resulting data from callback to it.
In data section of Ajax, I wrote a JSON data, JSON is a pair of key, value that is separated by a ‘:’.
$(".QueryText").val()
returns the typed words in text box
In success section, I splited the resulting string with ‘:’ character and assigned it an array (because JavaScript is a dynamic type checker you don’t need to specify the variable as array, it detects it automatically). Then I sent it to the response method as parameter. This is the only way to return data to the source property of Autocomplete. [return] keyword can’t do this (I wasted a lot of my time to return a value from return keyword, so you can save yours).
Among Autocomplete properties I’m going to discuss some of them. First delay, this parameter is to postpone the callback request to the server. It is very important to do this because ignoring it causes a lot of overhead on the server (it would be a self Denial of Service attack :D). The next is minLength, it depicts that your Autocomplete sends the request after typing a specific number of characters. It also reduces the overhead if you increase it to a meaningful number according to your need.
In header of your form I included JQuery file (jquery-1.5.1.min.js), Autocomplete plugin file (jquery-ui-1.8.custom.min.js) this is a customized file; you can generate it at this address. And also a CSS file that is the official released theme for Autocomplete; you can download and edit it.
Should you have any questions comment me.
Love and peace for you all.
MS Chart with C#
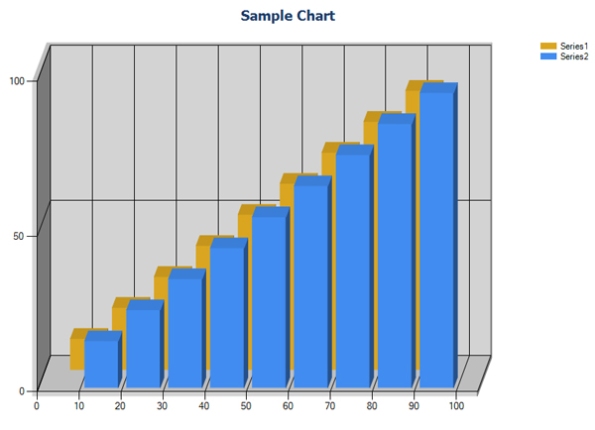
In this article I’d like to describe MS Chart (.Net 4.0) through an example. The picture below is the final result.
Initialization:
1- Create a temp folder to store temp image files (c:\TempImageFiles) and add some codes to your web config file.
<compilation debug="true" targetFramework="4.0">
<assemblies>
<add assembly=”System.Web.DataVisualization, Version=4.0.0.0, Culture=neutral, PublicKeyToken=31BF3856AD364E35″/>
</assemblies>
</compilation>
<appSettings>
<add key=”ChartImageHandler” value=”storage=file;timeout=20;dir=c:\TempImageFiles\”/>
</appSettings>
<system.web>
<httpHandlers>
<add path=”ChartImg.axd” verb=”GET,HEAD,POST” type=”System.Web.UI.DataVisualization.Charting.ChartHttpHandler, System.Web.DataVisualization, Version=4.0.0.0, Culture=neutral, PublicKeyToken=31bf3856ad364e35″ validate=”false” />
</httpHandlers>
</system.web>
In .Net 4.0 edition you don’t need to download and install any control to use MSChart, you just need to drag and drop it from Data section of MS Visual Studio 2010 toolbox to your form (But I really dislike doing this, it’s better to write code in source tab of your form). In order to code it, add System.Web.UI.DataVisualization.Charting namespace to your form.
In this sample I will go through coding MSChart at runtime. Once you learned this, you learned static one also.
Start Coding:
ASPX Form:
Add this code to your form, this is the only thing you need to have in your aspx form:
<asp:Chart ID="MSChart" runat="server">

</asp:Chart>
Code Behind:
Below codes are clear, you just add them in your cs file:
MSChart.Width = 900;

MSChart.Height = 600;

//It renders chart as an image and places it into an <img> html tag.

MSChart.RenderType = RenderType.ImageTag;

//Adds title to chart

Title t = new Title("Sample Chart", Docking.Top, new System.Drawing.Font("Tahoma", 14, System.Drawing.FontStyle.Bold), System.Drawing.Color.FromArgb(26, 59, 105));

MSChart.Titles.Add(t);
Chart Sections:
MS Chart has two primary sections, Series and CharArea. You can either have a design time data in these two sections or add data programmatically during runtime.
– Series are the most important part of each chart. Every chart has at least one series. A chart is a series of numbers which can be plotted into space as X and Y points. These numbers are dependent and depict a concept together regarding an issue. Assume that this series build a sine shape line, so this sine shape line is a series then you can add another series in the same chart to depict another meaning. These two series can be used to compare two different data of the same concept.
– ChartArea: Is a place that you want to plot your series (so it contains series). It is a collection; therefore your chart can contain multiple ChartAreas.
MSChart.Series.Add("Series1");

MSChart.Series["Series1"].ChartType = SeriesChartType.Column;

MSChart.Series["Series1"].Color = System.Drawing.Color.Goldenrod;

MSChart.Series["Series1"].YValueType = ChartValueType.Int32;
Series1 is added to the collection of MSChart.Series. Each series has some important properties. ChartType that specifies the type of chart which can be Column (Same as ours), Pie, Doughnut etc. Color is to specify color of series and YValueType is the type of values in Y axis.
MSChart.ChartAreas.Add("ChartMainArea");
After defining Series you should define ChartArea. You can easily add a chart area to the CharAreas collection.
Legends:
Legend leg = new Legend("Legend1");

MSChart.Legends.Add(leg);

MSChart.Legends[0].Alignment = System.Drawing.StringAlignment.Near;
In order to describe each series in a chart, Legends are used. To add them you can write the above code. Each ChartArea needs a legend; it automatically detects your series in a ChartArea.
Now it’s time to add data to our series:
Random _r = new Random();
for (int i = 10; i < 100; i+=10)

{
int n = _r.Next(0, 100);
MSChart.Series["Series1"].Points.AddXY(i, n);

}
Points.AddXY(x,y)
is a fast method to specify data of each point directly.
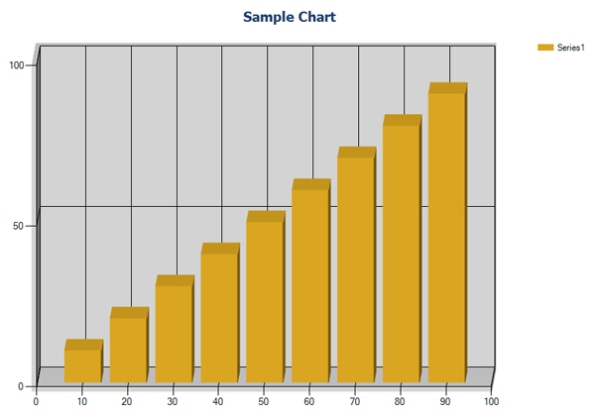
Up to now the below picture is created.
Theming and Appearance:
MSChart has some appearance properties that help your chart look more attractive. (Since chart is only for reporting purpose, either management or customer will see it, so make it the most beautiful :D, don’t forget the power of feelings).
You have definitely seen 3D charts. We want to develop one.
ChartArea3DStyle chartArea3DStyle = new ChartArea3DStyle();

chartArea3DStyle.Enable3D = true;

chartArea3DStyle.LightStyle = LightStyle.Realistic;

chartArea3DStyle.Rotation = 5;

chartArea3DStyle.Inclination = 40;

chartArea3DStyle.PointDepth = 50;

MSChart.ChartAreas["ChartMainArea"].Area3DStyle = chartArea3DStyle;
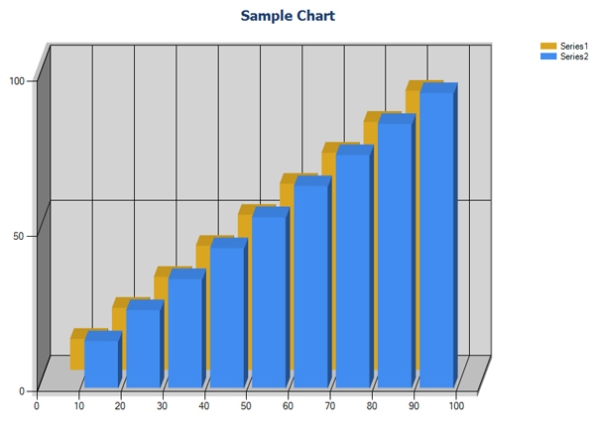
ChartArea3DStyle class has some properties to style a 3D chart. Then Area3DStyle property should be assigned with a ChartArea3DStyle object. After these simple changes you’ll have the below picture.
Adding more series:
It is really easy to add more series. Just write the following code:
MSChart.Series.Add("Series2");

MSChart.Series["Series2"].ChartType = SeriesChartType.Column;

MSChart.Series["Series2"].BorderWidth = 2;

MSChart.Series["Series2"].YValueType = ChartValueType.Int32;

for (int i = 15; i <= 100; i += 10)

{

MSChart.Series["Series2"].Points.AddXY(i, i);

}
It adds a new series and adds some points to it.
Wish you enjoyed it.
Peace and love for you all
References:
http://www.datadynamics.com/Help/ActiveReports6/arCONChartSeries.html

